
Rainbow Blossom CoStory
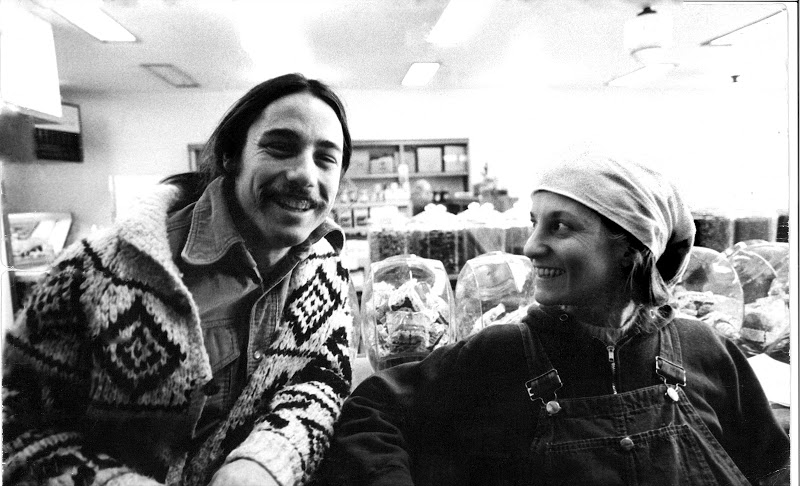
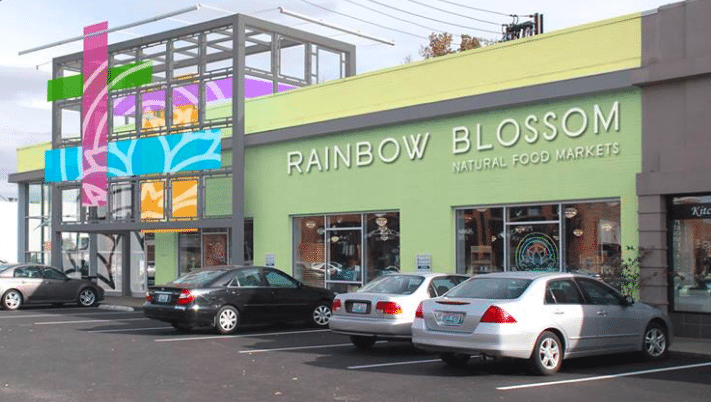
Rob and Pumpkin Auerbach started Rainbow Blossom Health and Wellness stores in 1977 in order to share their passion for a natural lifestyle. Today there are 5 Rainbow Blossom locations in and around the Louisville, KY area all with the mission of improving the health and wellness of their communities.

In 2014 Summer Auerbach, Rob and Pumpkin’s daughter, took over the management of Rainbow Blossom and is working to enhance not only the health of the community, but also the health of the company.
CoMetrics was instrumental in getting my bearings so I could figure out where to help the business
In 2016, Summer hired James Followell as the company’s first official CFO. James came to the company with impressive degrees, including a MBA and a JD, however, he had no previous experience in grocery retail. Fortunately, James had CoMetrics Benchmarking data to help him get the lay of the land.
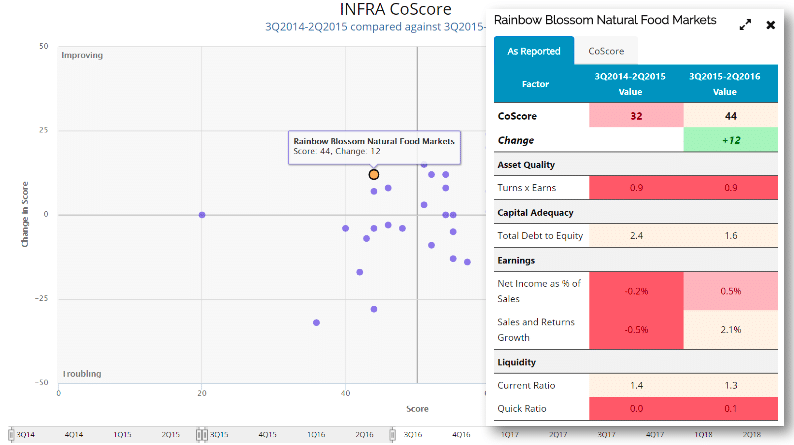
What James found was the company was getting into trouble with flat to declining sales, they were losing money and cash stores were declining. According to CoMetrics CoScore, Rainbow Blossom was falling behind the majority of INFRA (Independent Natural Food Retail Association) members with a score of 44, while the majority of the group had a score over 50. James dug deeper into the numbers using the data provided by CoMetrics.

The benchmarks showed that Earnings were problematic as sales were flat to declining and this was not an industry wide problem, it was specific to Rainbow Blossom. Gross Margin was inconsistent – high in some areas and low in others. Efficiencies weren’t ideal[b], as it appeared they were spending more than average on wages. Additionally, they were paying more on Fixed Expenses than the majority of the group. James took a deeper dive into the data in order to break down and resolve issues.
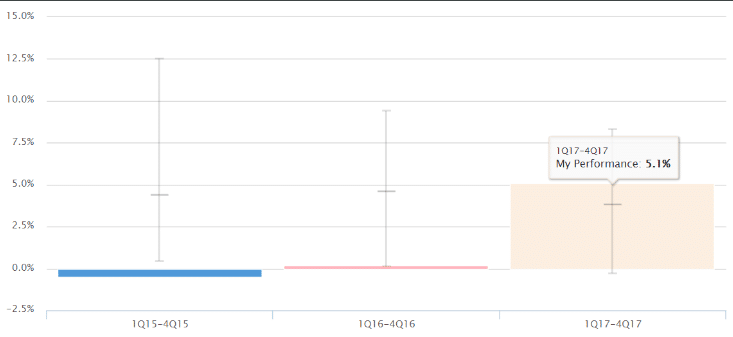
Sales and returns growth were lagging behind the group. Rainbow Blossom’s sales declined by 0.5% in 2015 while most of the INFRA member’s sales grew with over half the member’s sales growing by more than 4.4%. James fiound there was no rhyme or reason to sales decline or growth, it appeared to be random. Using the benchmarking data the team was able to analyze product specific trends and using the group’s average benchmark of 4.4% sales growth, strip away products that weren’t producing at a comparable rate. As a result Rainbow Blossom’s Sales and Returns Growth jumped up to 5.1% by 2017.
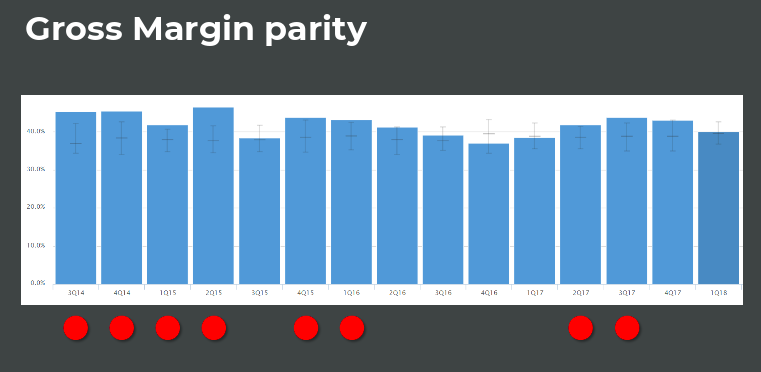
Rainbow Blossom’s Gross Margin was consistently higher than INFRA members. This motivated James to go product by product to see where they were over pricing and turning away customers or under pricing and selling at a loss. Additionally, with the benchmarking data, he was able to see where Rainbow Blossom was overpaying vendors for items compared to the rest of the group. He took the data to suppliers and was able to negotiate cost down to reflect the group’s average.
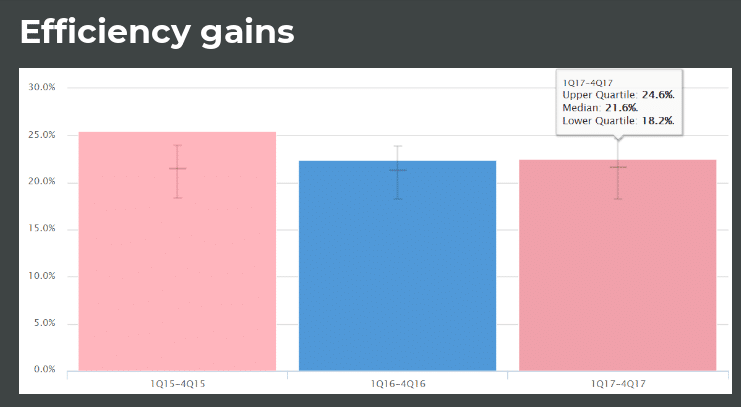
Efficiencies, such as wages were higher than the groups average. Personnel expenses were over 25% and the majority of INFRA members spent less that 22% of sales on personnel. This enabled James to take the data to the managers and show them what was possible based on the benchmarks. He motivated the team by offering them a $300 incentive for every quarter they came in at or under the the benchmark. It worked! Efficiency is now at 22% of sales.
Rainbow Blossom was paying more than the group average on Fixed Expenses such as Rent and Utilities. James took the benchmarking data to his vendors and was able to negotiate over a $17,000 dollar savings.
Rainbow Blossom is a different company because of CoMetrics.
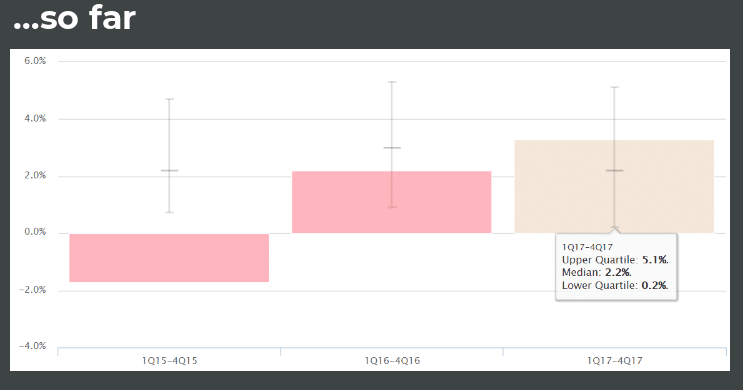


This is just the start for Rainbow Blossom! There is still room for more improvement as the upper quartile of the INFRA group is at 5.1% Net Income while Rainbow Blossom is at 4% Net Income. The CoMetrics data shows what is possible and highlights opportunities for improvement. Using this benchmarking data Rainbow Blossom will continue to develop strategy and chip away issues using the benchmarking data.